USDA Market Facilitation Program: Information on Payments for 2019
Fast Facts
For 2019, the USDA's Market Facilitation Program paid $14.4 billion to about 644,000 farming operations USDA said were hurt by trade disruptions and tariffs.
USDA changed the payment structure for the three types of commodities covered by this program for 2019. For example, it set county-specific payment rates for nonspecialty crops such as corn and soybeans. It also doubled the maximum payment to $250,000 for each type of commodity.
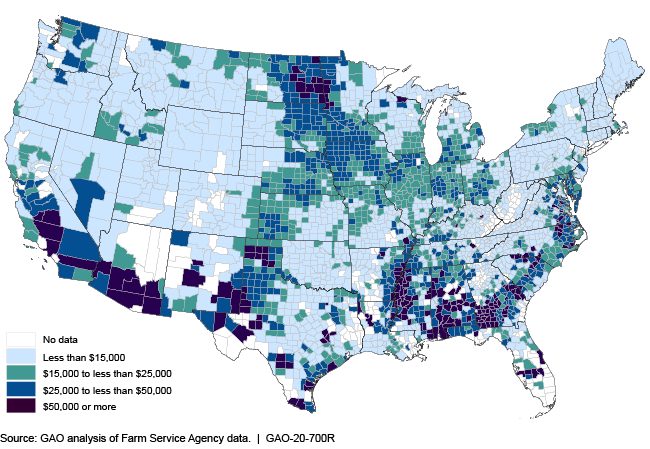
Payments varied by location. The average payment per operation was $22,312 but varied from a low of $44 to a high of $295,299. A number of counties had average payments per operation of $50,000 or more.
Average Market Facilitation Program Payment Per Farming Operation for 2019, by County

Highlights
What GAO Found
The U.S. Department of Agriculture's (USDA) Farm Service Agency (FSA) distributed about $14.4 billion in 2019 Market Facilitation Program (MFP) payments to farming operations in all 50 states and Puerto Rico. According to USDA, these payments were intended to offset the effects of trade disruptions and tariffs targeting a variety of U.S. agricultural products. FSA distributed these payments to 643,965 farming operations. The average MFP payment per farming operation for 2019 was $22,312 but varied by county, ranging from $44 to $295,299. MFP payments for 2019 also varied by type of commodity. Three types of commodities were eligible for 2019 MFP payments: (1) nonspecialty crops (including grains and oilseeds, such as corn and soybeans); (2) specialty crops (including nuts and fruits, such as pecans and cranberries); and (3) dairy and hogs.
Most of the 2019 MFP payments went to farming operations that produced nonspecialty crops. Less than 10 percent went to farming operations that produced specialty crops or dairy and hogs. USDA made approximately $519 million in additional MFP payments for 2019 compared with 2018 because of increases in payment limits—the cap on payments that members of farming operations can receive. FSA distributed these additional MFP payments to about 10,000 farming operations across 39 states. The amount of additional MFP payments that FSA distributed for 2019 varied by location. Farming operations in five states—Texas, Illinois, Iowa, Missouri, and Minnesota—received almost half of all additional payments.
Why GAO Did This Study
In May 2019, USDA announced it would distribute up to $14.5 billion in direct payments to farming operations that were affected by trade disruptions, following the approximately $8.6 billion USDA announced it had distributed for 2018. USDA referred to these 2018 and 2019 payments as the MFP. In comparison with 2018, USDA changed the 2019 payment structure for the three types of commodities that were eligible for payments. For example, USDA increased the payment limit for each of these three types. GAO was asked to review the distribution of MFP payments for 2019.
This report examines, among other things, MFP payments for 2019 and how they varied by location, farming operation, and type of commodity, as well as additional MFP payments for 2019 compared with 2018 that resulted from increased payment limits. To accomplish these objectives, GAO analyzed data from USDA and interviewed agency officials knowledgeable about the data.
For more information, contact Steve Morris at (202) 512-3841 or morriss@gao.gov.
