Federal Government Contracting for Fiscal Year 2018 (infographic)
With tax season over, now is a good time to look at how the government uses your tax dollars.
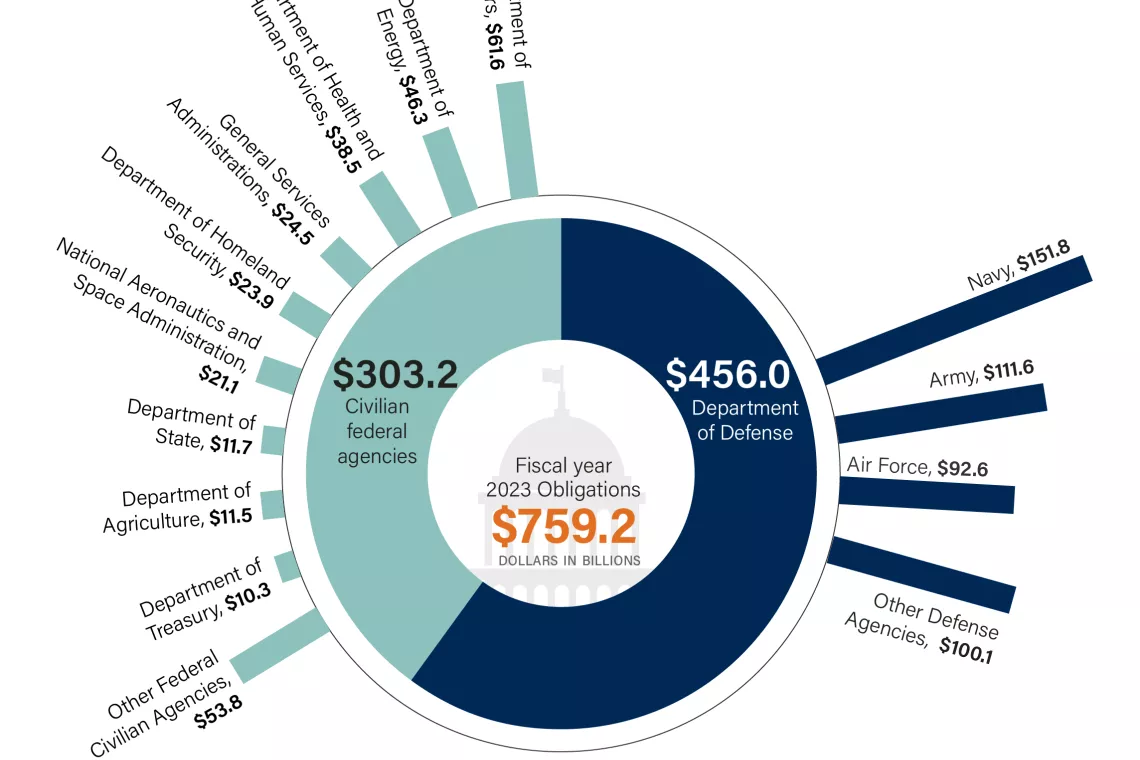
About 40% of the government’s discretionary spending goes to contracts for goods and services covering everything from health care to hand grenades. In fiscal year 2018, the federal government spent more than $550 billion on these contracts, an increase of more $100 billion from 2015. This increase is largely driven by spending on national defense.
Our infographic shows more details on how federal contracting dollars are spent across the federal government—including which agencies obligated the most funds, what they bought, and whether the contracts were competed.

The infographic was updated on May 29, 2019 to correct a labeling error under “Top 5 Civilian Services and Products.”
There are currently 4 areas related to contracting on our High Risk List:
- VA Acquisition Management
- Department of Energy’s Contract and Project Management for the National Nuclear Security Administration and Office of Environmental Management
- NASA Acquisition Management
- DOD Contract Management
For more detailed reports of some of the government’s largest acquisition programs, read our assessments of DOD, NASA, and DHS acquisitions.
Comments on GAO’s WatchBlog? Contact blog@gao.gov.


