Geographic information systems (GIS) are powerful tools that display spatial information (such as locations on a map) in order to help us understand patterns and relationships about our world.
So, with National GIS Day on November 16th, the WatchBlog is looking at how this technology helps us communicate clearly and answer complex questions about
loan programs,
Amtrak service, and more.
Using GIS to identify…
When we wrote a report on the safety and health conditions of 185
Bureau of Indian Education elementary and secondary schools at 180 locations around the United States, we wanted to show our readers where, exactly, the schools in question were located.
The GIS map we created for the report gives readers a sense that the schools are located primarily in rural areas and small towns. The map also sets the stage for our finding that 15 BIE schools with dormitories are located in remote areas where the nearest fire station is an average of 35 miles away.
The information in this map helps convey the urgency of addressing the poor safety conditions we found:
 (Excerpted from GAO-16-313)
…and analyze
The real power of GIS lies in its ability to compare many types of geographic data to examine how they relate to each other.
For example,
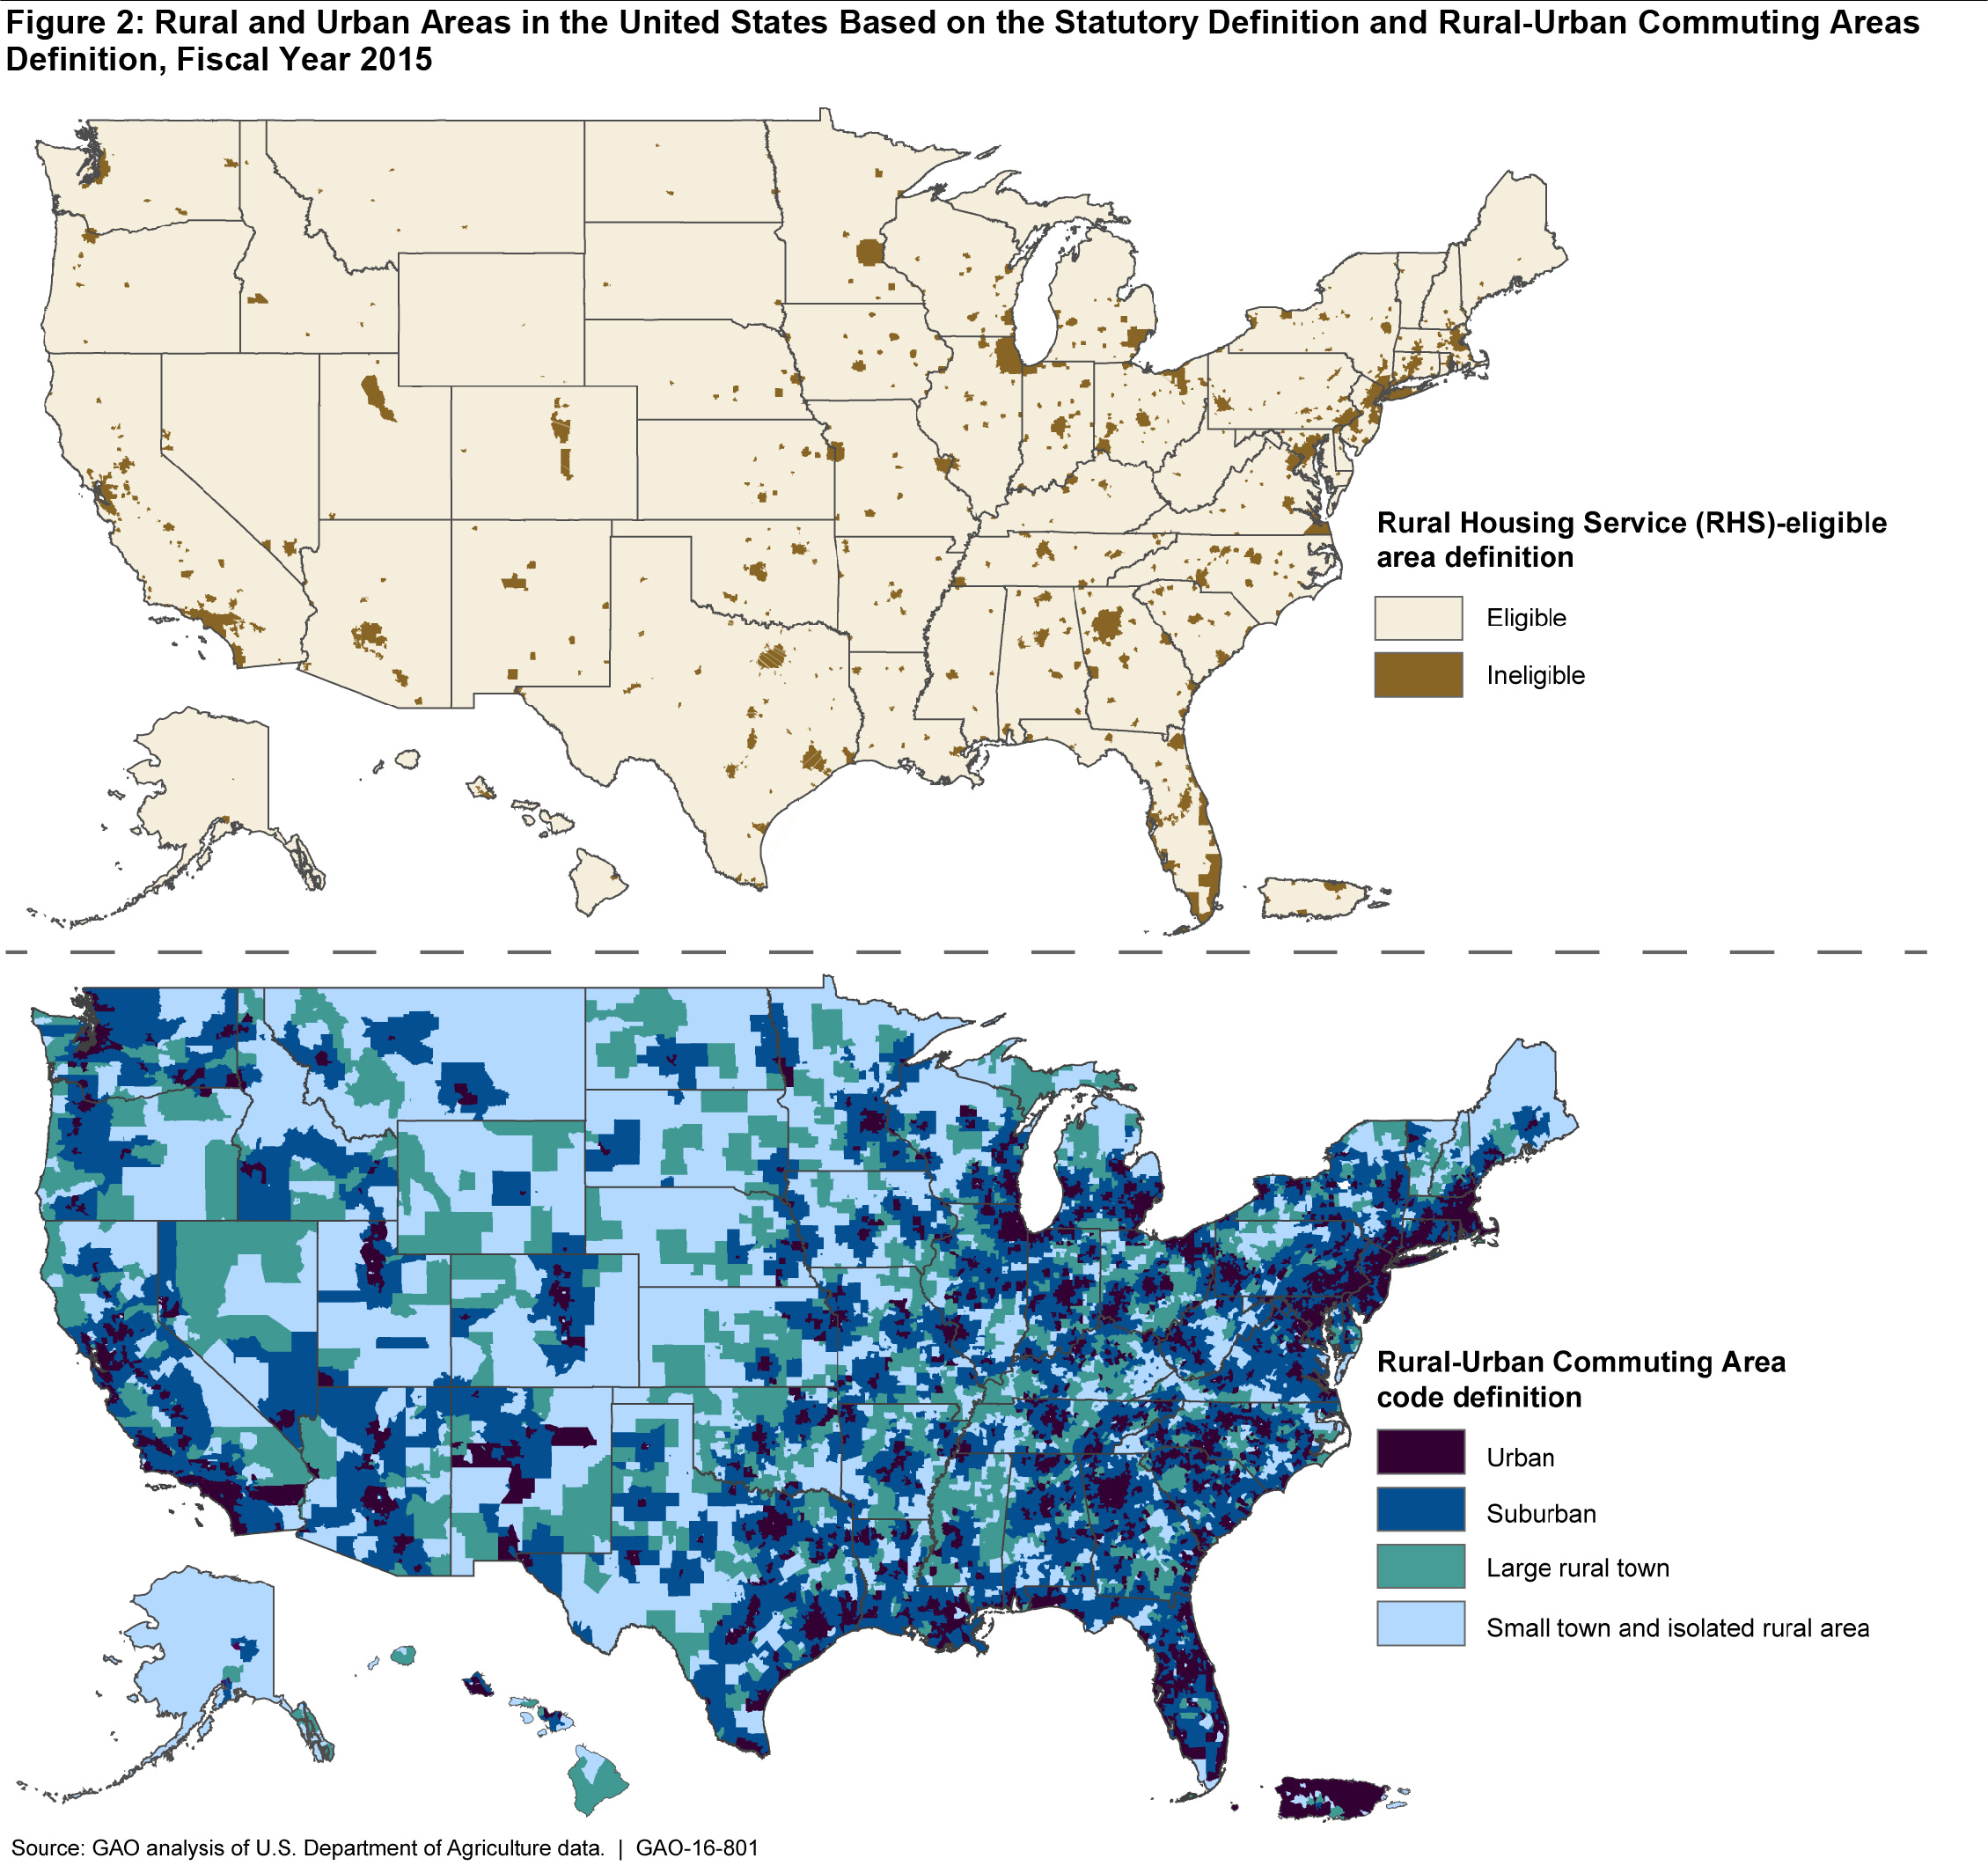
we looked at two home loan guarantee programs administered by the Rural Housing Service and the Federal Housing Administration. The GIS maps we made showed us that the way the Rural Housing Service defines “rural” areas for the purposes of loan eligibility is much broader than the way that other agencies define “rural” areas.
With 97% of U.S. land area (and 37% of the population) qualifying as “rural” for Rural Housing Service loans, it is easy to see on the maps how that program might overlap significantly with the Federal Housing Administration program, which doesn’t have any geographic limits.
 (Excerpted from GAO-16-801)
Another example is from a recent report on Amtrak. To understand the competition Amtrak faces from other modes of travel in rural areas, we used GIS to
estimate the number of other transportation options (i.e., bus or air travel) within a 30-minute driving radius of each Amtrak station on its long-distance routes.
We found that about 70% of rural Amtrak stations are located within a reasonable driving time of one or more alternative transportation options. Mapping this information can show where Amtrak faces competition on its network of routes, and where to conduct more analysis of its scheduling and operations.
You can see this in our interactive graphic of one of Amtrak’s long-distance routes. It shows which Amtrak stations offer limited, late-night arrival and departure times and if they are close to other travel options, such as intercity buses. To use the interactive features of the graphic, download the report PDF, go to p.65, and roll your mouse over stations on the map.
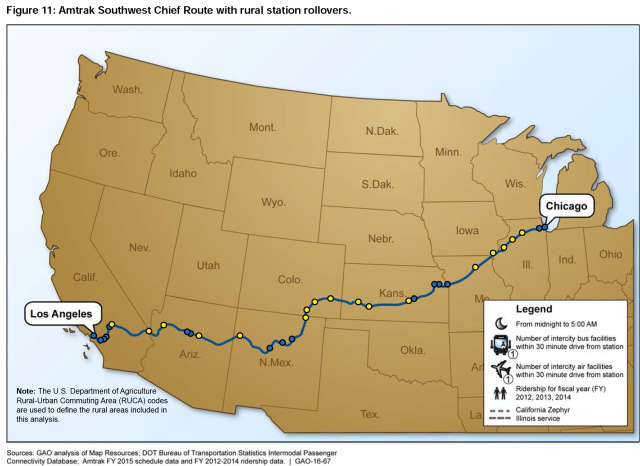 (Excerpted from GAO-16-67)
To explore these and other reports, please visit our website at
www.gao.gov.
 (Excerpted from GAO-16-801)